What is TradingView & How to Use it for Trading?
In the stock market checking the details of stock or indices technically as well as fundamentally is very important to perform the online share trading or investing strategy. When you check the price of a stock, you most probably also see the charts to know the trend of that particular script with the broader market indices and other underlying securities.
And if you have knowledge and experience in analyzing the stock technically and fundamentally you need all the indicators, tools and financial ratios to check and compare the price and valuation of stocks. Even traders or analysts also use the best trading platform and create profitable strategies while analyzing the stocks or any underlying index for trading.
What is Trading View?
TradingView is one the most advanced stock market applications or web-based platforms to show the various details required to trade or invest in financial markets like equity, commodity and currency. Apart from showing the real-time price data through a chart, it also provides the tools, indicators and financial details of the selected stock for analysis.
Traders or investors using the TradingView application on their desktop or smartphone can draw charts, customize the price data and check the key ratios to create the right strategy for trading. Equipped with the most advanced features, and working on various cross-platforms, TradingView is very user-friendly and shows accurate and refreshed data.
How Tradingview Works?
TradingView simply works on the algorithms to take the real-time data from the exchange and show it at the user end through the software. Apart from real-time data, this investment app also shows the historical price data of stock, commodity or currency with other key details like financial statements, technical indicators, parameters and key ratios like valuation ratios and financial ratios with news, corporate actions and other various other key information.
It can be installed or integrated on various web-based compatible platforms and works with computer systems connected to the internet. End-users can create their account on TradingView or use this through their broker website login details to use the various functions. Though, for direct use TradingView only limited features are available in the free version, in the PRO version it gives access to advanced and more useful functions for the traders and users.
How to Use Tradingview?
Using the TradingView is very easy and user-friendly, especially if have the knowledge and experience to draw the charts and apply the technical indicators. However, we brought here the stepwise procedure to use the Tradingview and its features.
Steps to Use the TradingView Web Application:
Step 1: First of all create your account with TradingView and login.
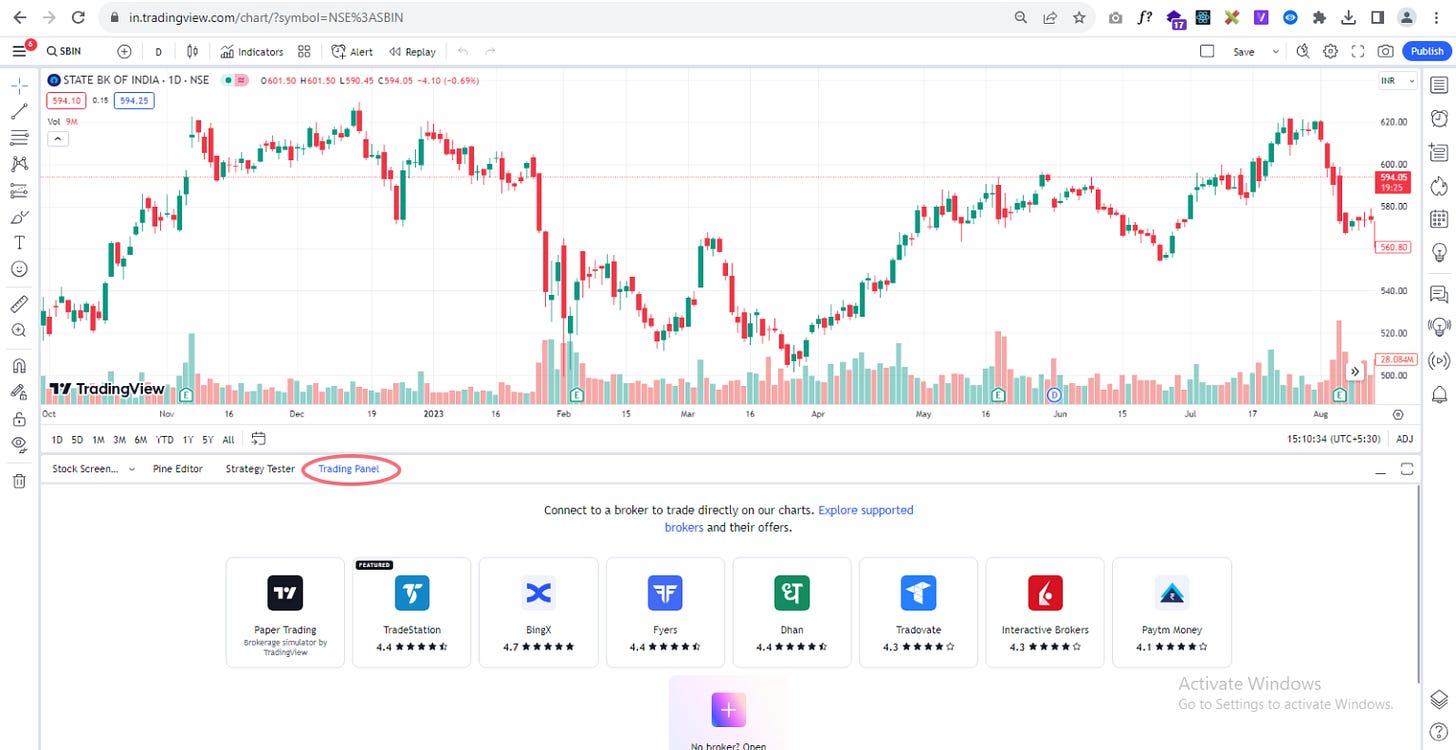
Step 2: Now after login, you will see the TradingView dashboard on your screen.
Step 3: To see the charts you can select the stock by searching name or symbol.
Step 4: Now you can choose the tools and draw the technical indicators on the chart.
Step 5: Using these tools and indicators you can analyse the stock movement.
Step 6: You can also check the financial details and key ratios of the stock.
Step 7: If you are connected with your broker you can place orders directly.
Step 8: You can also use the TradingView community to share your ideas and trading strategies.
Using TradingView directly through the website freely you will get the limited functions and features to use. For applying or using important technical indicators, creating alerts, saving the charts opening multiple tabs, customization or viewing the key financial details and valuation ratios you have to buy the paid version of TradingView.


Comments
Post a Comment